In this post we will learn how to monitor computers and services with Nagios. This will allow us to receive timely and actionable alerts about issues in our infrastructure.
- What is Nagios.
- Nagios: How it works.
- Description of the scenario we are working with in this post.
- Installing Nagios.
- Monitoring services and computers.
- At-a-glance overview of our devices and services.
- Testing notifications.
- Closing thoughts.
What is Nagios.
Nagios is an application that monitors computers, services, networks and infrastructure. It sends alerts in case of trouble, and it sends notifications when the issue is resolved.
Unlike other commercial alternatives like SolarWinds, Nagios is both free and Open Source and it also offers the option of purchasing a support plan.
Nagios: How it works.
Nagios can obtain information about the monitored resources in two different ways:
-
Using the Nagios Agent: After deploying the Agent to the computers you want to monitor, these agents collect the information and perform the checks by themselves before sending them to the Nagios server. -The main advantage of this method is the flexbility it offers, since we can define custom checks and write code to monitor any resource we can think of. The disadvantage would be that we have to push the definition of these custom checks to the clients.
-
Agentless : The Nagios server uses the facilities provided by the device that is being monitored (for example, VMI or SNMP).
- The main advantage of this mode is that it reduces the complexity of our deployment, and it allows us to centralize all the configuration in the Nagios server. The disadvantage would be that it does not allow for custom checks, so if the device does not provide a facility for monitoring a resource we can’t monitor it this way.
Nagios is able to use both modes at the same time, combining the results from agent checks and from agentless checks.
Monitored service states, and transition flow between states.
The state of a resource is determined through two components:
- The state of the service or resource: OK, WARNING, UP, DOWN...
- The type of state the resource is in: soft or hard.
To prevent false positives caused by temporary circumstances, Nagios will perform the check a number of times before considering a problem to be “happening”. This number of retries is defined by the max_check_attempts variable, and if the limit is reached Nagios will change the issue from soft to hard. This also works in reverse, before marking an issue as solved the check is repeated this same number of times.
Unless we specify otherwise, notifications are only set when a resource is hard down.
We can write our own handler for these events to perfom custom actions depending on the resource state. For example, if the web server is soft down and the check has been retried 3 times already, we can trigger the deployment of a secondary instance of the web server and add it to the load balancer in anticipation of the main web server going down.
An in-depth description of the states is available in the manual.
A resource is “flapping”. What does “flapping” mean?
When a resource is rapidly and repeatedly transitioning between OK and a state that means an issue is happening, the resource is tagged as flapping. This could indicate a deeper issue, or be caused by perfectly normal conditions, for example we know for sure that the database becomes unresponsive at a certain time of the day because of heavy load, and we know it does not affect regular operations.
In any case, flapping would generate many notifications about the same issue. In order to mitigate this situation, we should increase max_check_attempts to a value that allows these false positives to fall under the threshold and be careful to not increase too much that issues go unreported.
Nagios contains logic that tries to address flapping, but given the nature of the problem it might not be enough to eliminate the problem in our specific environment.
Description of the scenario we are working with in this post.
We have three virtual machines in the same network, all three using Debian 8 (Jessie).
- nagiosHost: 192.168.100.1, will function as the Nagios server. It will also host a MongoDB instance, and an SSH server.
- servidorLamp: 192.168.100.2, will have a LAMP stack installed.
- escritorioUsuario: 192.168.100.3, will be a desktop for the end-user to use.
This scenario can be deployed automatically through the use of this Vagrantfile, including all services and configuration.
Installing Nagios.
sudo DEBIAN_FRONTEND=noninteractive apt-get -y install nagios-plugins nagios3 nagios-nrpe-pluginnrpe-server is the name of the Agent software that is installed in the monitored machines, and will send status reports back to the Nagios server as well as executing remote checks. As we have explained at the beginning, these checks can be customized by the administrator, and nagios-plugins is a package that contains many useful pre-defined checks. Later on we’ll explain how to install additional components that will enable us to monitor a MongoDB database and how to create our own custom checks to, for example, check for the existence of zombie processes.
To be able to run checks on-demand, we have to make the following change on /etc/nagios3/nagios.cfg
check_external_commands = 1We must also change the owner and mode of these two directories, so the nagios service is able to write temporary files to them. If we were to not do this, we would get error messages along the lines of Could not stat() command file ‘/var/lib/nagios3/rw/nagios.cmd’.
We will implement these changes at the package manager level, to preserve them in case of updates.
dpkg-statoverride --update --add nagios www-data 2710 /var/lib/nagios3/rw
sudo dpkg-statoverride --update --add nagios nagios 751 /var/lib/nagios3
We are also going to create a new user called ‘nagiosadmin’ with the password ‘nagios’ to be able to access the web panel. Then, we restart the service so all our changes go into effect.
htpasswd -b -c /etc/nagios3/htpasswd.users nagiosadmin nagios
service nagios3 restart
Monitoring services and computers.
Services exist inside of devices, logically speaking. We are going to install the monitoring agent in nagiosHost, and the process is exactly the same to monitor the other two devices on our network: servidorLamp and escritorioUsuario.
Installing the monitoring agent.
DEBIAN_FRONTEND=noninteractive sudo apt-get install -y --force-yes build-essential nagios-nrpe-server nagios-pluginsWe enable remote custom commands.
sudo sed -i "s/.*dont_blame_nrpe.*/dont_blame_nrpe = 1/" /etc/nagios/nrpe.cfgAnd we whitelist the server.
sudo sed -i "s/.*allowed_hosts.*/allowed_hosts = 127.0.0.1 192.168.100.1/" /etc/nagios/nrpe.cfgAdding devices to the monitoring list
conf.d is a folder that is consumed in its entirety to build the runtime configuration. We can split the settings however we see fit, following the criteria that fits our infrastructure best.
These steps are to be perfomed on nagiosHost.
/etc/nagios3/conf.d/nodes.cfg contains the list and addresses of the computers we are going to monitor. In our specific scenario, these would be its contents.
define host{
        use                     generic-host
        host_name               nagiosHost
        alias                   nagiosHost
        address                 127.0.0.1
}

define host{
        use                     generic-host
        host_name               servidorLamp
        alias                   servidorLamp
        address                 192.168.100.2
}

define host{
        use                     generic-host
        host_name               escritorioUsuario
        alias                   escritorioUsuario
        address                 192.168.100.3
}
Devices belong to groups, and monitoring policies can be applied to groups. We are going to store these definitions in /etc/nagios3/conf.d/hostgroups_nagios2.cfg.
define hostgroup {
        hostgroup_name  all
        alias           All Servers
        members         *
}

define hostgroup {
        hostgroup_name  debian-servers
        alias           Debian GNU/Linux Servers
        members         nagiosHost,escritorioUsuario
}

define hostgroup {
        hostgroup_name  http-servers
        alias           HTTP servers
        members         nagiosHost, servidorLamp
}

define hostgroup {
        hostgroup_name  ssh-servers
        alias           SSH servers
        members         nagiosHost
}

define hostgroup {
        hostgroup_name  mongo-servers
        alias           Mongo servers
        members         nagiosHost
}
Defining services to monitor
/etc/nagios3/conf.d/services_nagios2.cfg contains the definitions of the services we wish to monitor across groups of devices.
define service {
        hostgroup_name                  http-servers
        service_description             HTTP
        check_command                   check_http
        use                             generic-service
        notification_interval           0 ; set > 0 if you want to be renotified
}

define service {
           hostgroup_name                  ssh-servers
           service_description             SSH
           check_command                   check_ssh
           use                             generic-service
           notification_interval           0 ; set > 0 if you want to be renotified
}
/etc/nagios3/conf.d/nagiosHost.cfg
This file will contain the services we wish to monitor on nagiosHost: number of currently logged-in users, number of processes running and cpu load over time.
define service{
        use                             generic-service
        host_name                       nagiosHost
        service_description             Current Users
        check_command                   check_users!20!50
}

define service{
        use                             generic-service
        host_name                       nagiosHost
        service_description             Total Processes
                check_command                   check_procs!250!400
}

define service{
        use                             generic-service
        host_name                       nagiosHost
        service_description             Current Load
                check_command                   check_load!5.0!4.0!3.0!10.0!6.0!4.0
}
/etc/nagios3/conf.d/escritorioUsuario.cfg
Likewise for escritorioUsuario: this will contain the relevant definitions to check for zombie processes.
define service{
        use                             generic-service         ; Name of service template to use
        host_name                       escritorioUsuario
        service_description             Zombie processes
                check_command           check_host_for_zombies
}
Since this is a custom check, we need to explicitly define it.
Adding custom service checks.
Custom service checks are defined in two parts: A mandatory definition in the Nagios server, and an optional second definition in the monitored device.
In the Nagios server, we have to define the custom command name that will be run through on the server itself.
In the monitored device, the definition of the custom command we are going to run inside the monitorized device itself.
If we need to gather information about the state of the monitored device that can only be collected by running code on the device, then the secondary definition becomes necessary.
For example, in our scenario we are going to check for zombie processes and if a MongoDB server is available. To gather information about the list of processes on the monitored machine, we have to run code on the machine itself. To ascertain whether a MongoDB server is up and accepting connections, we can do that from the outside by trying to connect to the MongoDB server like any other client would.
Checking for zombie processes.
Nagios server
/etc/nagios3/commands.cfg
define command {
    command_name    check_host_for_zombies
    command_line $USER1$/check_nrpe -H $HOSTADDRESS$ -c check_zombies
}
Monitored device.
/etc/nagios/nrpe_local.cfg
command[check_zombies]=/usr/lib/nagios/plugins/check_procs -w 0 -s Z+Installing additional plugins to monitor other services.
To be able to monitor the state of the MongoDB database on nagiosHost, we are going to install nagios-plugin-mongodb. The process is very similar to adding a custom check: the only explicit difference is that we don’t have a check_mongodb command already available in the PATH, thus we have to install it first.
Installing nagios-plugin-mongodb
Since the plugin is coded in Python, the install process is very simple. We are going to clone the repository on the Nagios server, install the requirements and then the python MongoDB connector.
cd /usr/lib/nagios/plugins
git clone git://github.com/mzupan/nagios-plugin-mongodb.git
pip install requirements
python -m pip install pymongo
We add the relevant service definition to the configuration. Since we may add additional MongoDB servers in the future, it makes sense to define it as a service that applies to a group of hosts.
/etc/nagios3/conf.d/services_nagios2.cfg
define service {
    use                 generic-service
    hostgroup_name          mongo-servers
    service_description     Mongo Connect Check
    check_command           check_mongodb!connect!27017!2!4
    contact_groups admins
}
commands.cfg
define command {
    command_name    check_mongodb
    command_line $USER1$/nagios-plugin-mongodb/check_mongodb.py -H $HOSTADDRESS$ -A $ARG1$ -P $ARG2$ -W $ARG3$ -C $ARG4$
}
The syntax of check_mongodb.py is explained in the documentation, and each plugin we install may have a different syntax.
Setting up email notifications
Nagios has the ability to send notifications emails to contact groups, which obviously contain contacts. Let’s create a contact called root that will belong to the contact group admins.
/etc/nagios3/conf.d/contacts_nagios2.cfg will contain the list of contacts. It also contains the name of the commands used to send the notifications, which we’ll define later.
define contact{
        contact_name                    root
        alias                           Root
        service_notification_period     24x7
        host_notification_period        24x7
        service_notification_options    w,u,c,r,f
        host_notification_options       d,r,f
        service_notification_commands   notify-service-by-email
        host_notification_commands      notify-host-by-email
        email                           correo@servidor.com
}
And /etc/nagios3/conf.d/contact_groups_nagios2.cfg will contain the list of groups, along with their memberships.
define contactgroup {
        contactgroup_name       admins
        alias                   Level 7 Administrators
        members                 root
        }
Now, we need to add to each service the groups that we’d like to be notified in case of issues using the contact_groups variable. For the SSH service, it would look like this.
define service {
           hostgroup_name                  ssh-servers
           service_description             SSH
           check_command                   check_ssh
           use                             generic-service
           notification_interval           0 ; set > 0 if you want to be renotified
           contact_groups admins
}
Customizing the email contents and the sending methods.
In this post we will use _sendemail, to be able to send the emails through the use of GMail’s SMTP servers.
sudo apt-get install sendemailWe have to adapt the email-sending syntax on commands.cfg.
define command{
	command_name	notify-host-by-email
        command_line /usr/bin/printf "%b" "***** Nagios *****\n\nNotification Type: $NOTIFICATIONTYPE$\nHost: $HOSTNAME$\nState: $HOSTSTATE$\nAddress: $HOSTADDRESS$\nInfo: $HOSTOUTPUT$\n\nDate/Time: $LONGDATETIME$n" | /usr/bin/sendEmail -xu $USER4$ -xp $USER5$ -t $CONTACTEMAIL$ -f $CONTACTEMAIL$ -o tls=auto -s smtp.gmail.com  -u "** $NOTIFICATIONTYPE$ Host Alert: $HOSTNAME$ is $HOSTSTATE$ **" -m "***** Nagios *****\n\nNotification Type: $NOTIFICATIONTYPE$\nHost: $HOSTNAME$\nState: $HOSTSTATE$\nAddress: $HOSTADDRESS$\nInfo: $HOSTOUTPUT$\n\nDate/Time: $LONGDATETIME$\n"
}

define command{
	command_name	notify-service-by-email
        command_line /usr/bin/printf "%b" "***** Nagios *****\n\nNotification Type: $NOTIFICATIONTYPE$\n\nService: $SERVICEDESC$\nHost: $HOSTALIAS$\nAddress: $HOSTADDRESS$\nState: $SERVICESTATE$\n\nDate/Time: $LONGDATETIME$\n\nAdditional Info:\n\n$SERVICEOUTPUT$" | /usr/bin/sendEmail -s smtp.gmail.com -xu $USER4$ -xp $USER5$ -t $CONTACTEMAIL$ -f $CONTACTEMAIL$ -u "** $NOTIFICATIONTYPE$ Service Alert: $HOSTALIAS$/$SERVICEDESC$ is $SERVICESTATE$ **" -m "***** Nagios *****\n\nNotification Type: $NOTIFICATIONTYPE$\n\nService: $SERVICEDESC$\nHost: $HOSTALIAS$\nAddress: $HOSTADDRESS$\nState: $SERVICESTATE$\n\nDate/Time: $LONGDATETIME$\n\nAdditional Info:\n\n$SERVICEOUTPUT$"
}
You could further customize the command line to include other channels of communications. We could add SMS notifications through Twilio or messages through Slack, for example.
Variables $USER4 and $USER5 will contain our GMail username and password, used to authenticate against the SMTP server.
/etc/nagios3/resource.cfg
$USER4$=username
$USER5$=password
WARNING: These credentials are stored in plaintext. Besides using proper file permissions, it is recommended we use service credentials generated explicitly and uniquely for Nagios. In GMail’s case, we can enable 2-Factor authentication and generate an app password.
At-a-glance overview of our devices and services.
We can get a bird’s-eye view of our infrastructure through the use of the map view in the web interface.
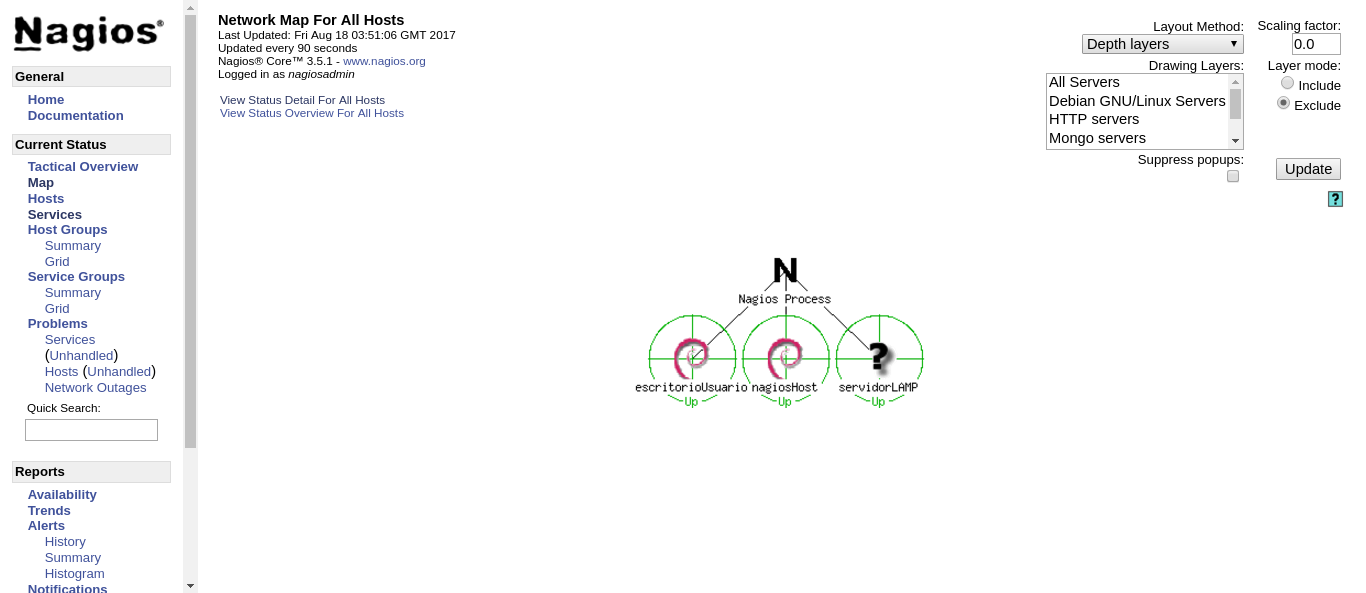
If we click on any of the devices, we get a quick view of the services’ health.
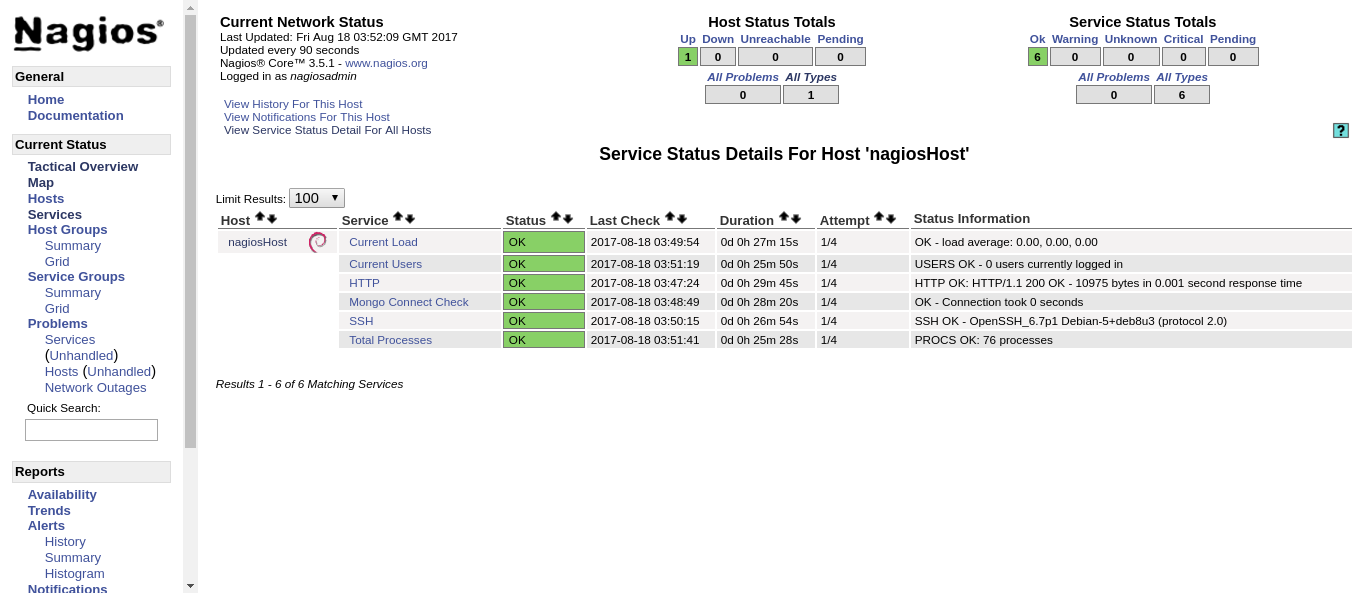
Testing notifications.
Device offline.
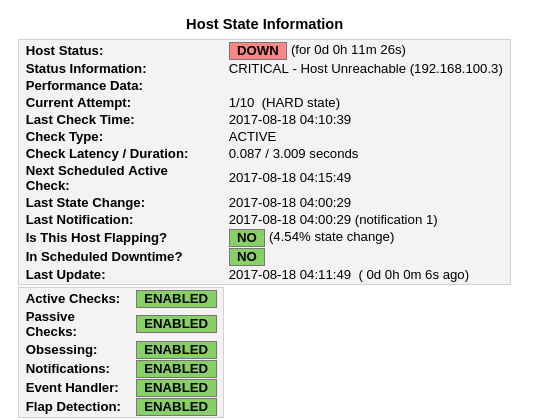
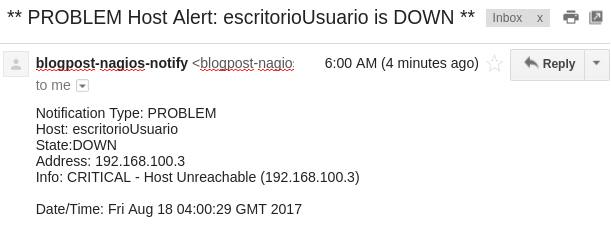
What happens if escritorioUsuario is offline? The expected behaviour is that Nagios will retry the connection a number of times, and then notify us that we have a problem if the device is still not responding.
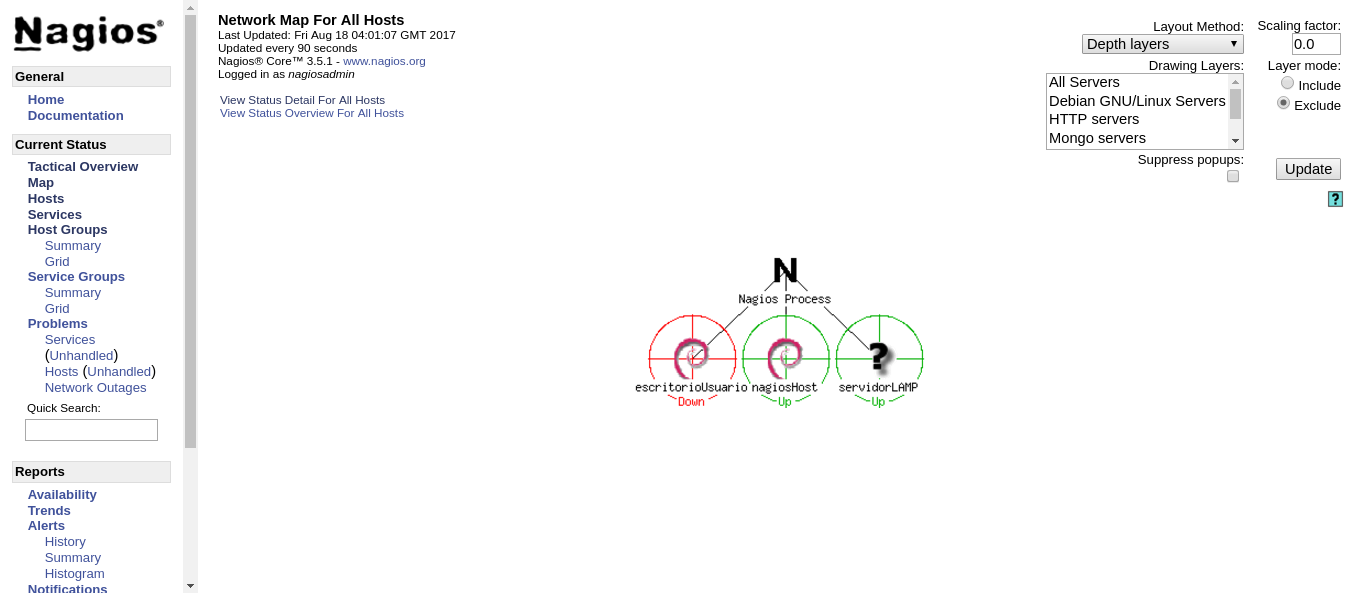
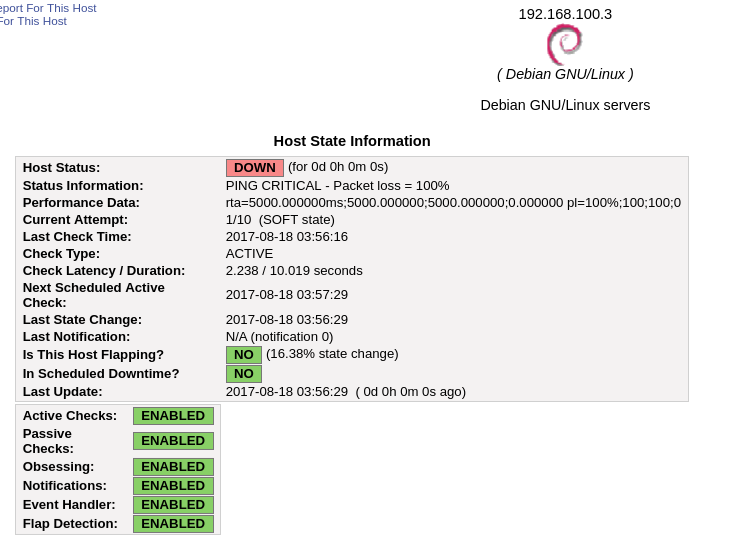
After a number of retries, Nagios marks the device as officially offline and proceeds to send an email notification.
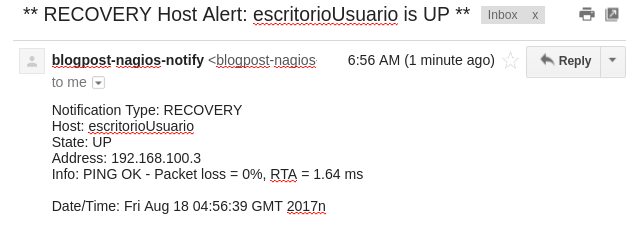
After the machines comes back online, Nagios detects that the problem has been solved and notifies us.
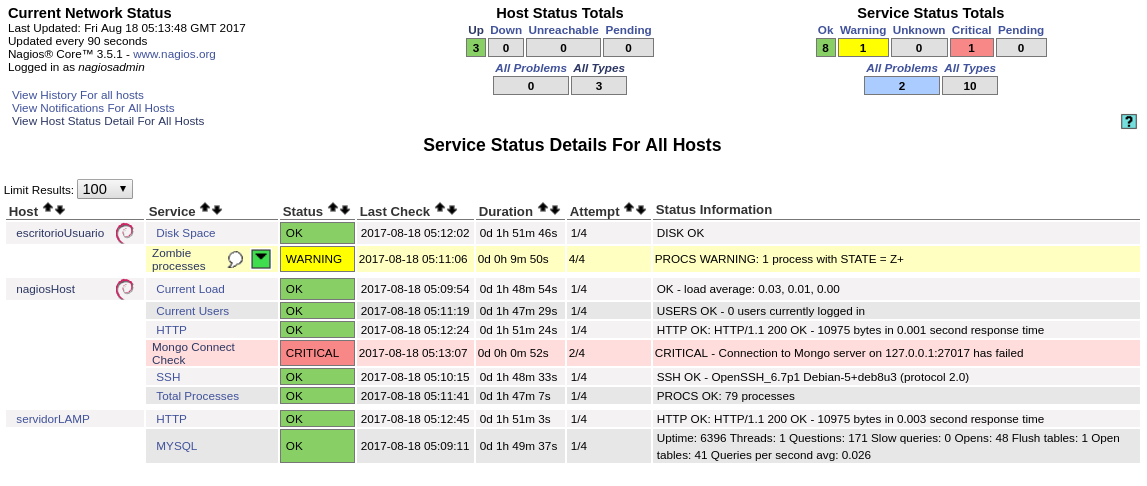
Zombie process.
To generate a zombie process, we execute the following line on the terminal of escritorioUsuario.
sleep 1 & exec /bin/sleep 600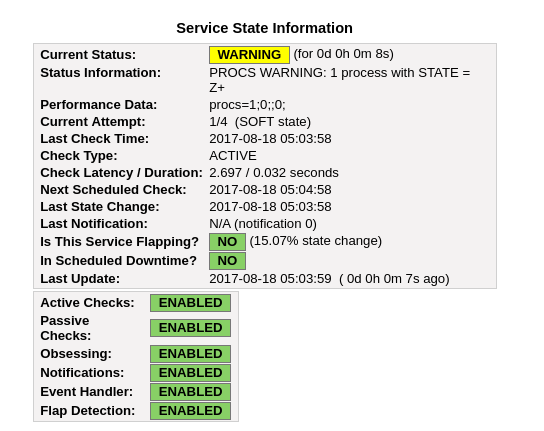
MongoDB server availability.
If we were to stop the MongoDB service to simulate a failure state, we can see that Nagios detects that new connections are not being established and sends an email notification about the matter.
Closing thoughts.
It is of vital importance that we are aware of issues in our infrastructure before the customers are.
Nagios allows us to condense down all the information about the state of our deployment into an easily glanceable dashboard, and the time investment required to set it up is worth the peace of mind of knowing our infrastructure is healthy and if that were to change we would be the first ones to know.